Code Quality Dashboard
 /
11 December 2020
5 min read
/
11 December 2020
5 min read
Why is code quality so important?
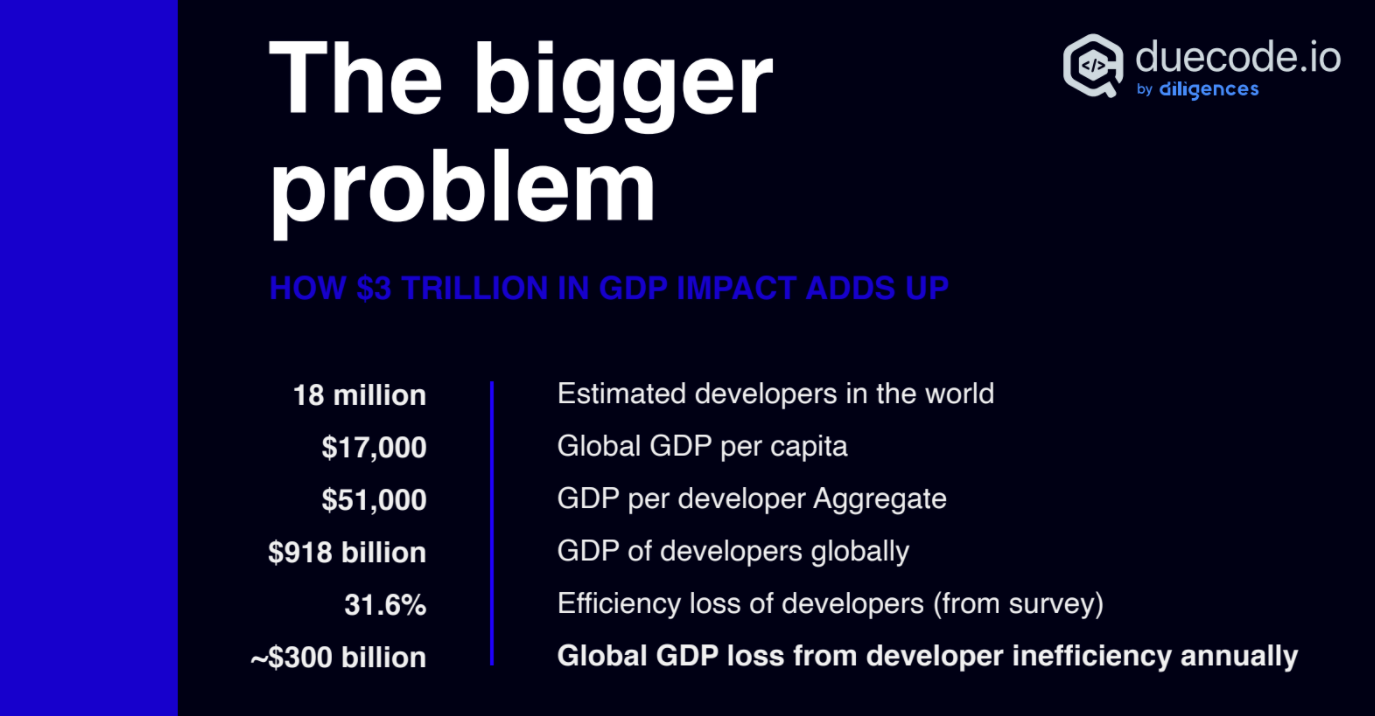
Code quality is essential to every developer, project, and product. If the quality of the code is smelly, it could lead to money losses or inefficient use of time due to maintenance, testability, or reusability. Statistics say:” ‘bad code’ costs companies $300 billion annually and 31,6% efficiency loss of developers.”
Luckily, in 2021 we have a bunch of tools for writing high-quality code, so you can deliver better products, make updates as fast as possible, and decrease technical debt in your codebase. The only thing you have to do is to make the right choice.
In this article, I would like to introduce you to code quality dashboards that will help improve any software product or project. You will learn how Duecode helps to reduce complexity, stay tuned with your team, get valuable insights on each developer, find pain points and tackle them early on, ensure adequate code coverage, and measure the effectiveness of your engineering team.
By the end, you’ll have an in-depth Duecode guide you need to create cleaner code—and an understanding of the tool that will help you to audit, debug, run, and maintain.
Dashboards
With Duecode you get an in-depth analysis of every aspect in your codebase:
- Daily code rating
- Code metrics by developer
- Code metrics by repository
- High-impact violations by commit
- High-impact violations by developer
- Code output timeline
- Fat commits
- Comments size
- Tickets mentioned
- Code affected by developer
- Developers
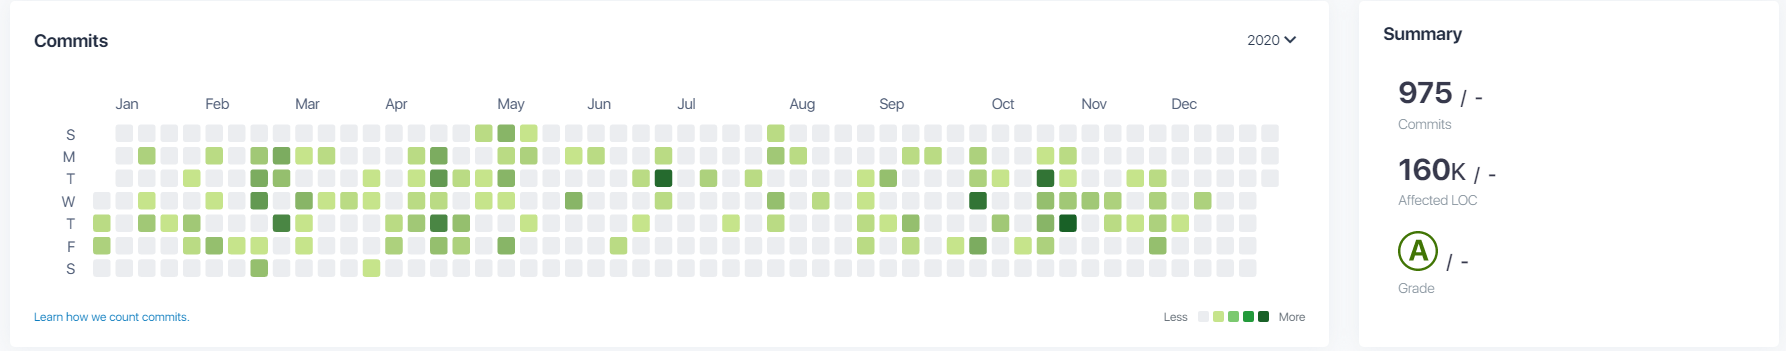
- Commits
- Violations
- Overview
A brief description and a huge impact: code quality dashboards examples
Daily code rating
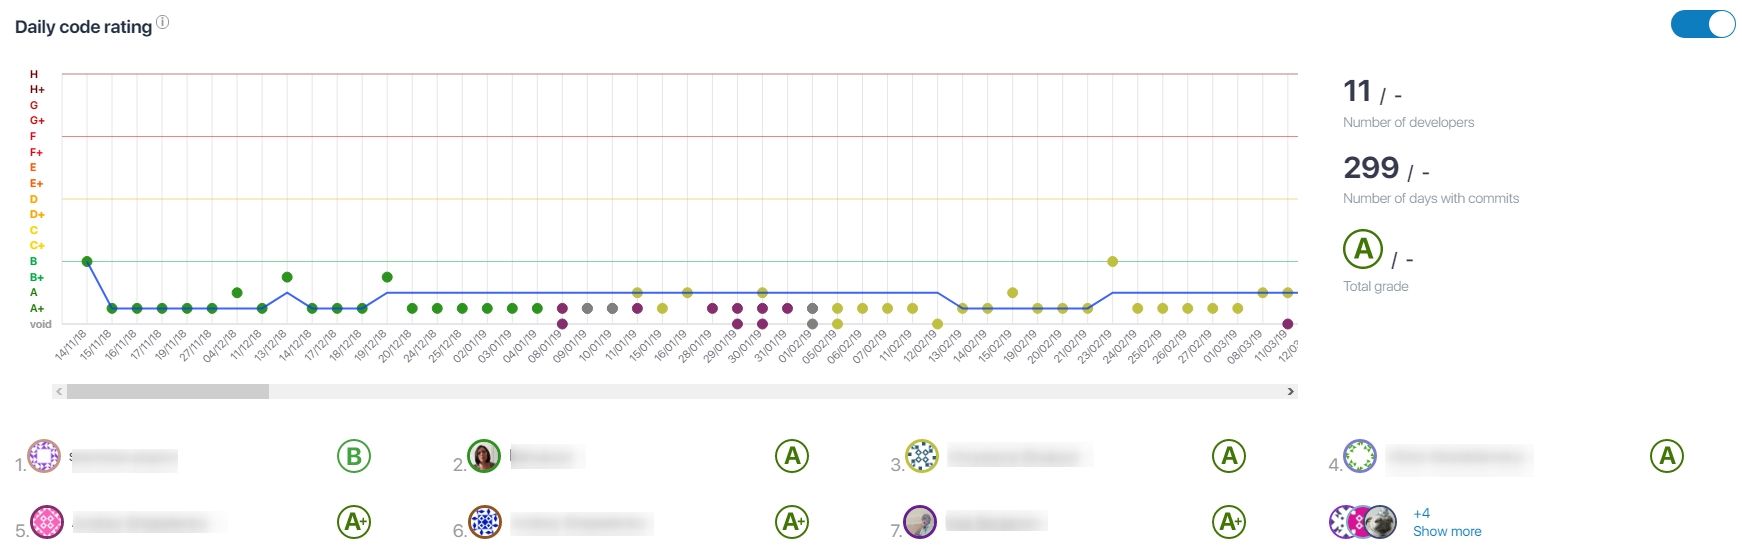
This dashboard shows Code Quality Rating for each commit, developer and overall value for a selected period. 4 bands, A+ is best, H is worst. Void are commits with no scannable code.
Code Metrics by developer
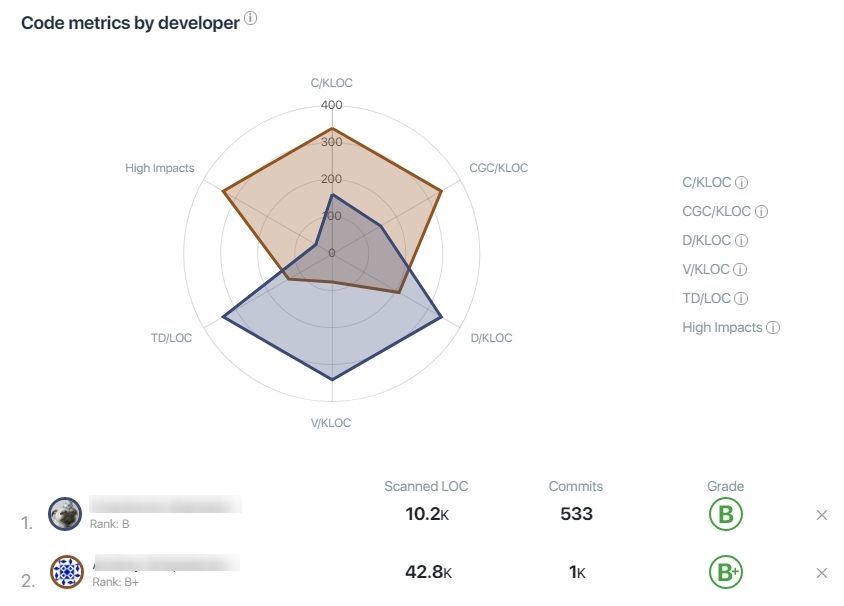
Aside from Code Quality Rating this chart provides 6 additional data points to understand each developer profile better. The lower the values the better it is. Thus a smaller chart area corresponds to a higher quality output.
Code Metrics by Repository
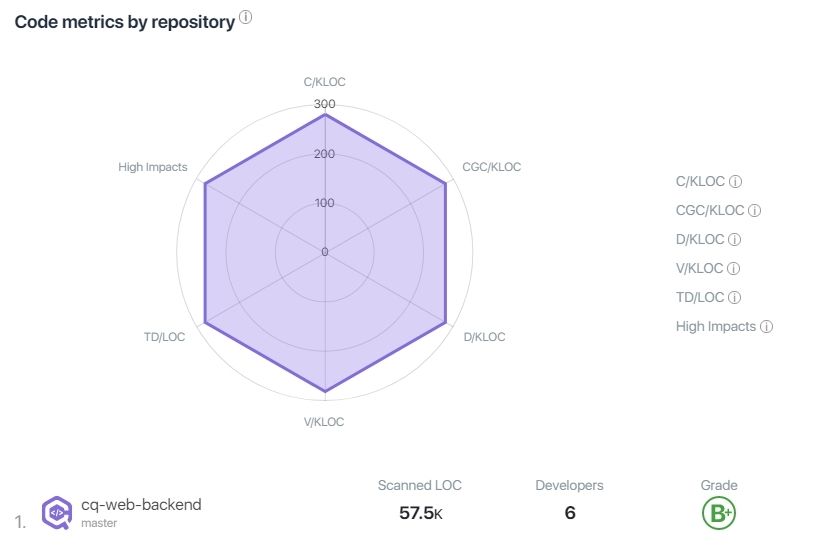
Aside from Code Quality Rating this chart provides 6 additional data points to understand each repository better. The lower the values the better it is. Thus a smaller chart area corresponds to a higher quality of the code.
High-impact violations by commit
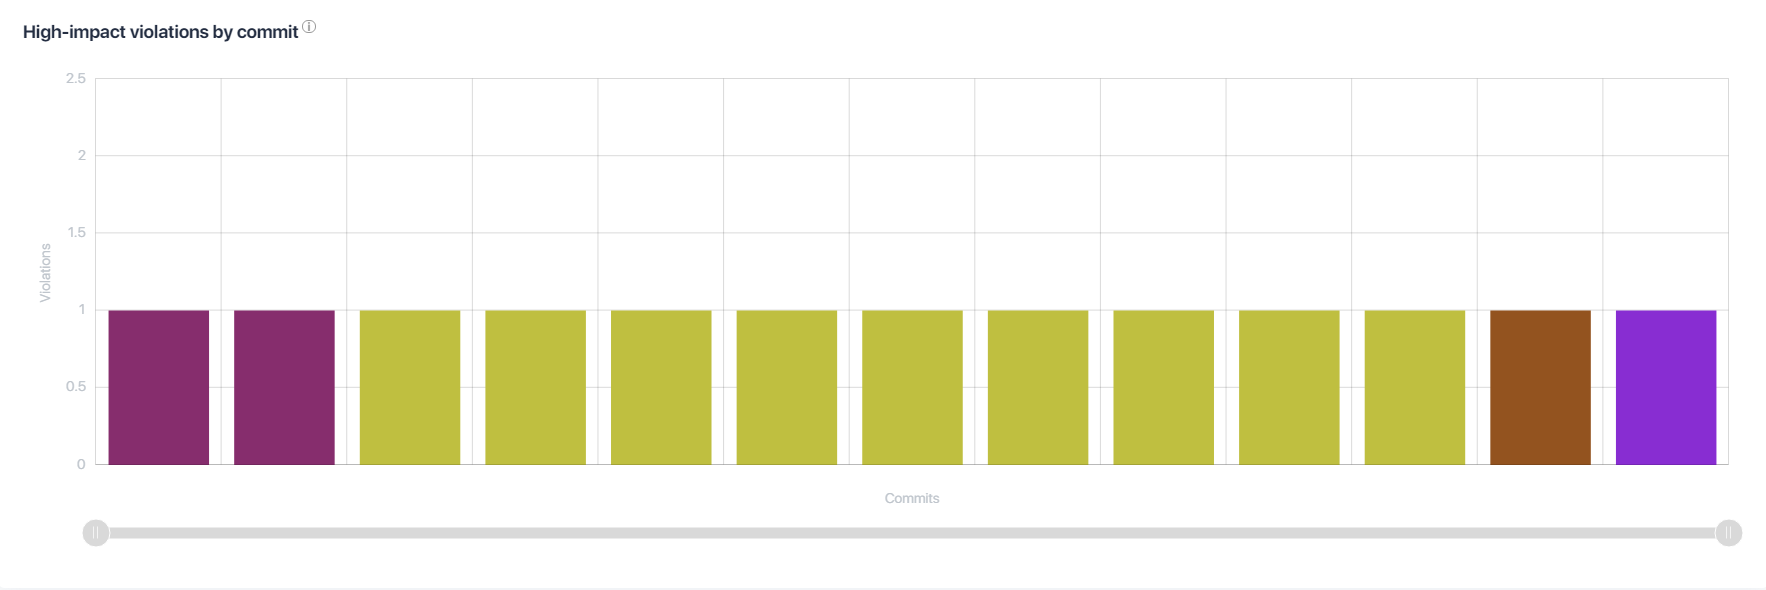
This dashboard shows an amount of high-impact code issues in each commit. It's important to fix High-Impacts first and not have them in the codebase as they're code issues with highest risk to operational stability and security of your codebase.
High-impact violations by developer
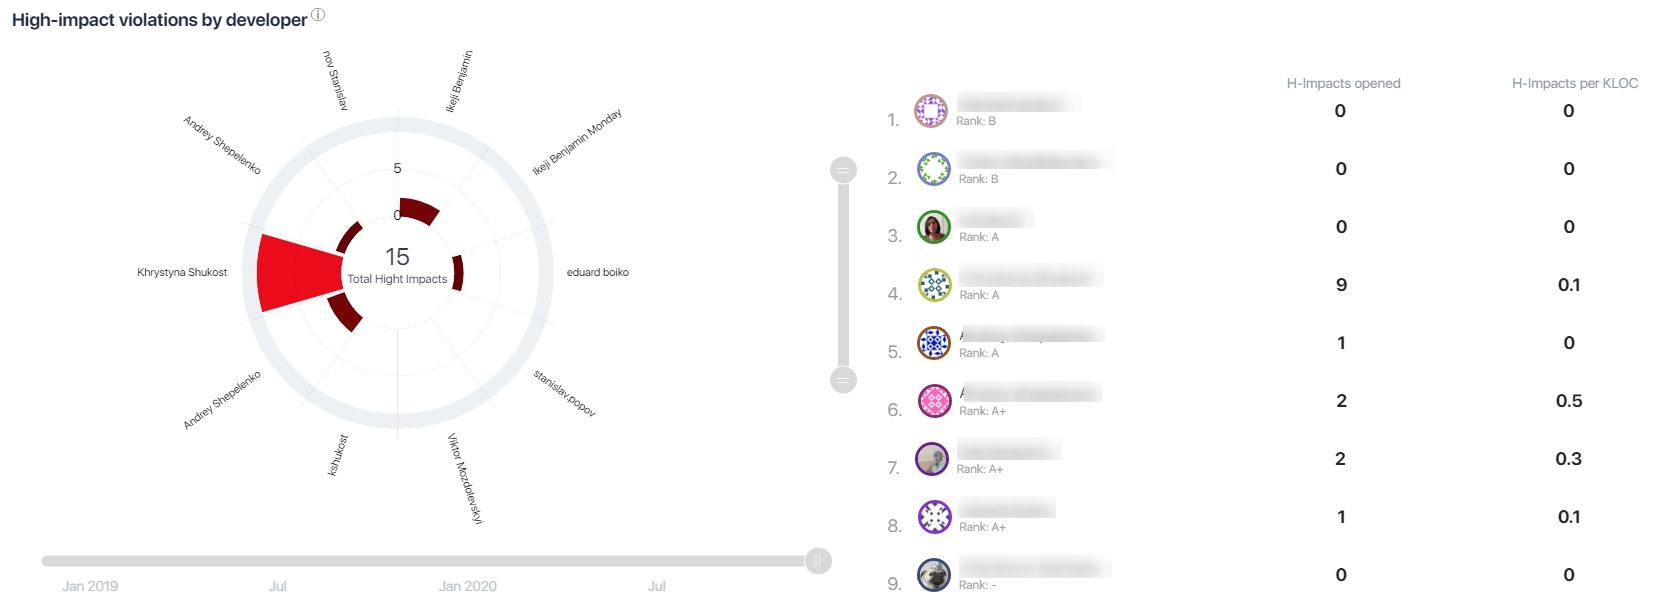
Unlike previous code quality dashboards, these charts represent an amount of high-impact code issues existing in the code, split by each developer.
Code output timeline
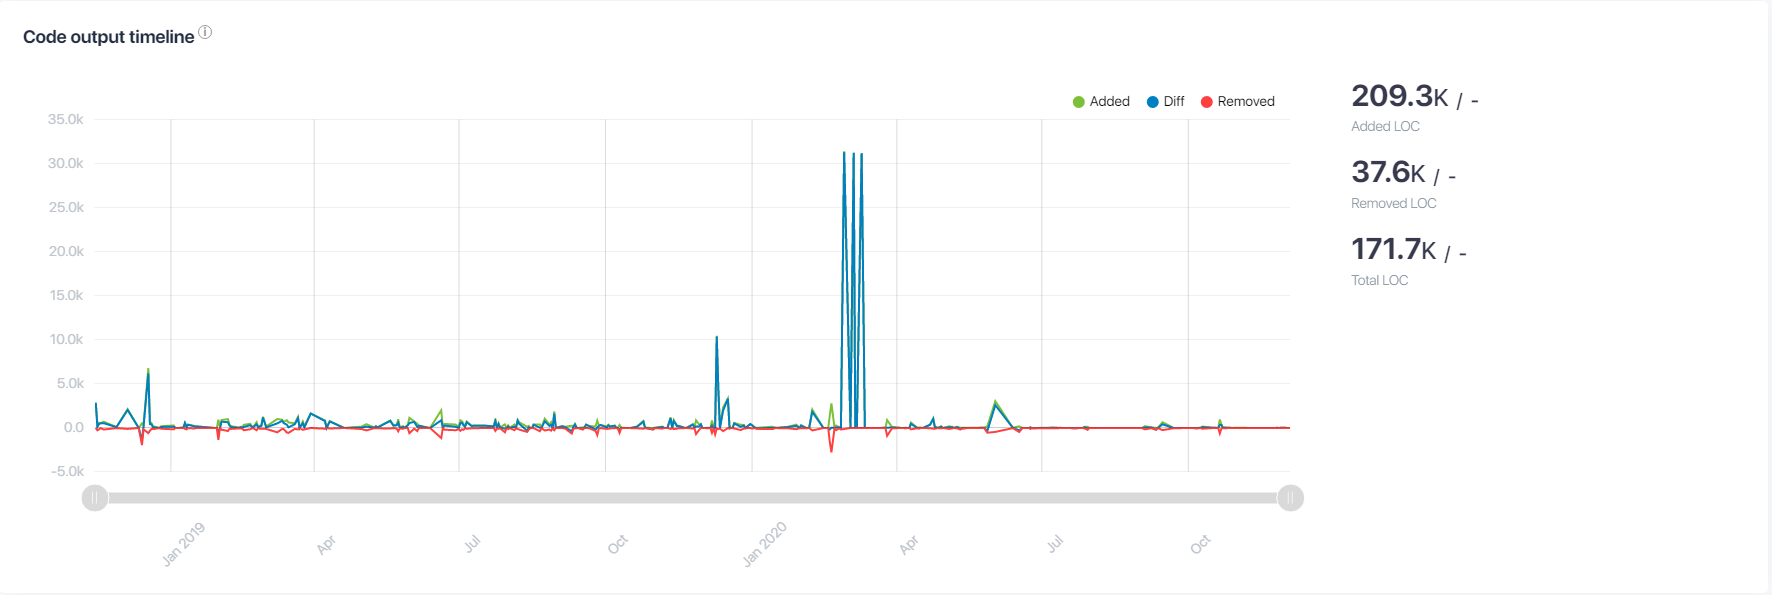
These graphs display an amount of lines of code (LOC) added and deleted. Plus the overall value for each timepoint.
Fat commits
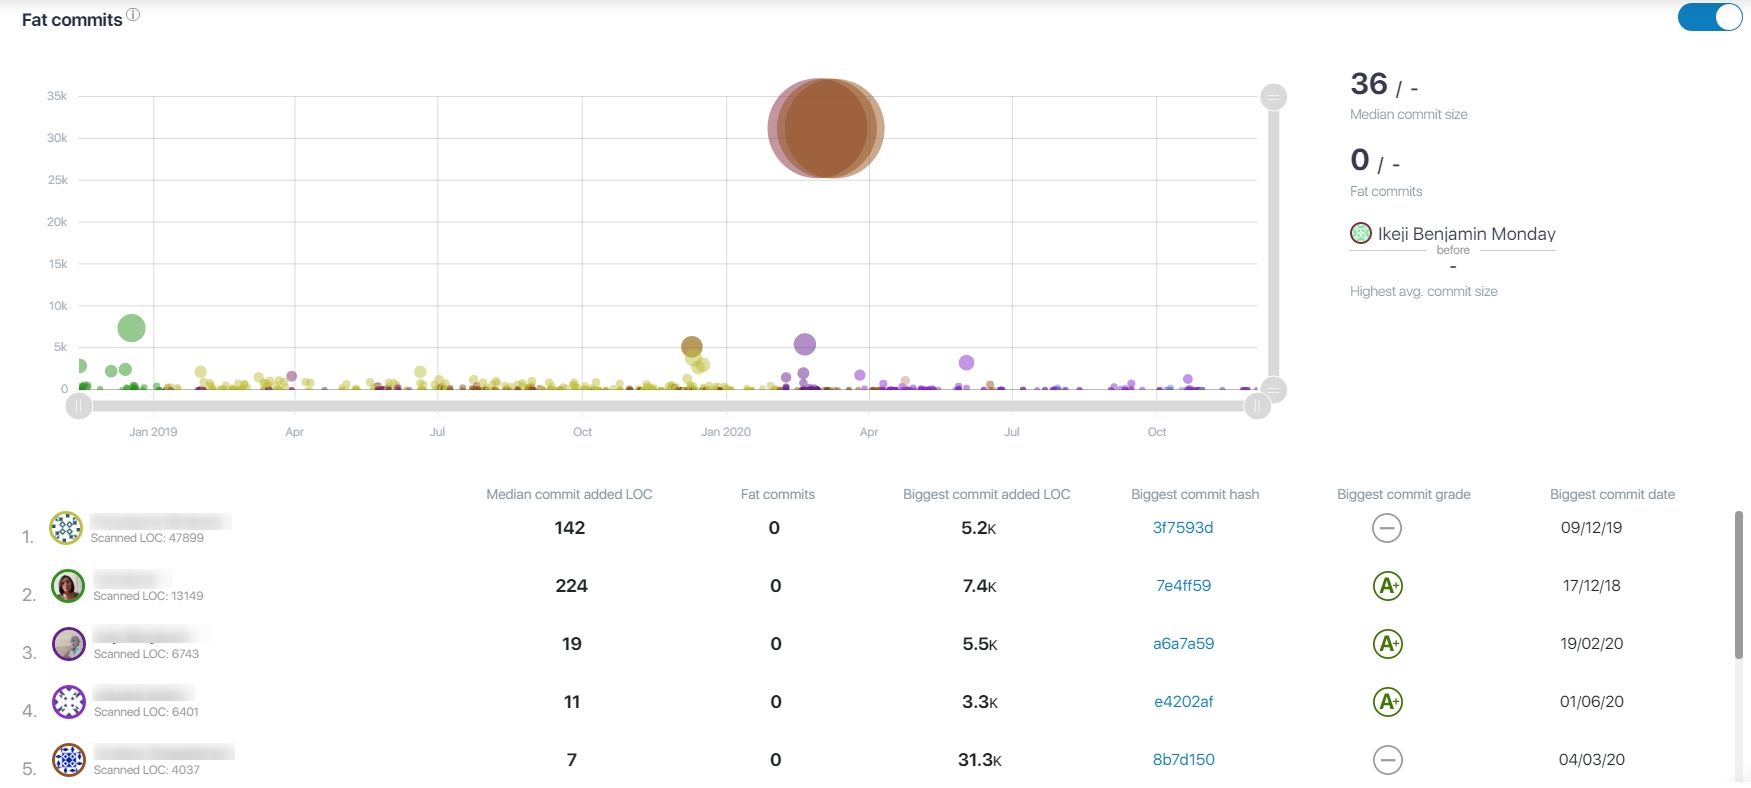
Fat commits are an amount of commits that are 8 times bigger than the median commit to the codebase.
Fat commits signal one of the following:
- It's a 3-rd party code scanned that distorts the metrics;
- It's a legacy code that distorts the metrics;
- Some developers prefer to commit big portions of code which isn't the best practice.
Comments size
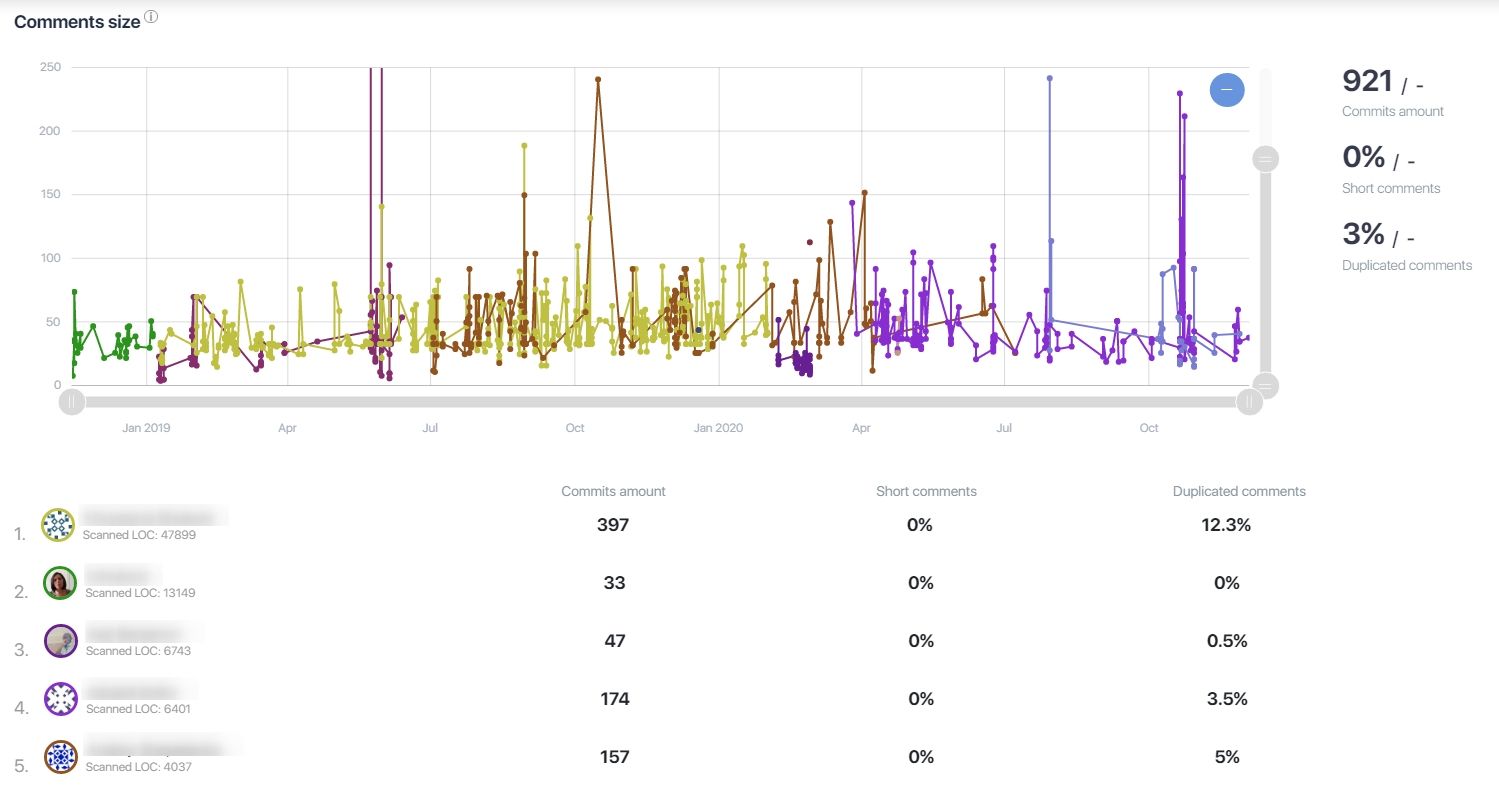
Amount of symbols in commentary to each commit. The chart provides a bird-eye-view on comments sizes. The rule of thumb is that the bigger the comment size the more careful the developer with communicating what he worked with. Consistency is also important.
Tickets mentioned
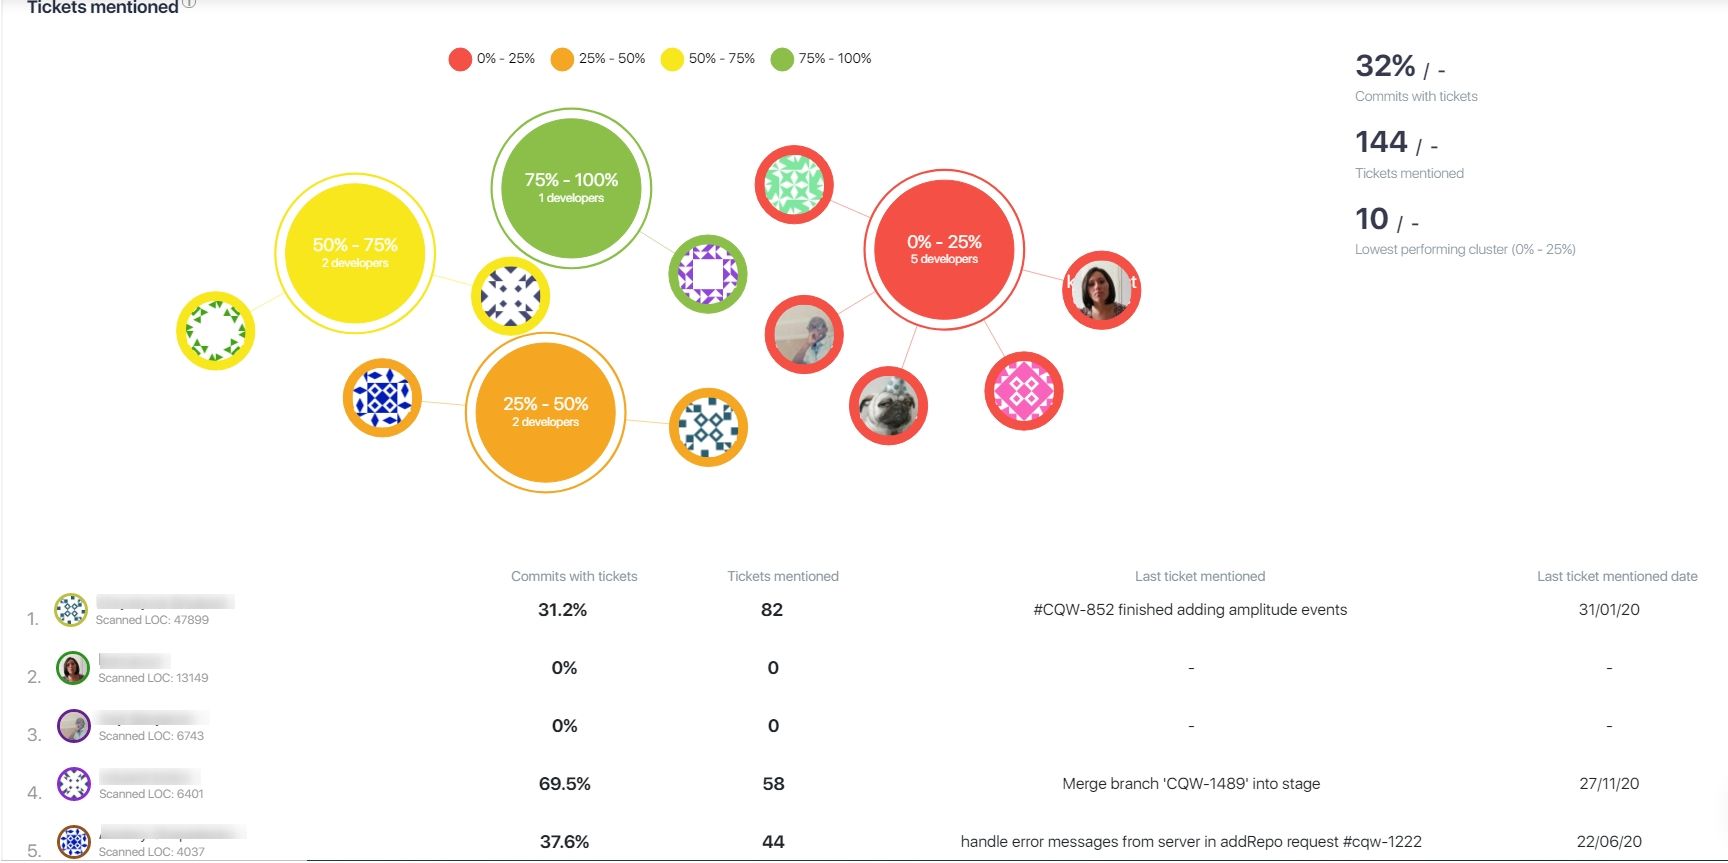
Percentage of tickets mentioned in the comment to each commit comparing to all
amount of commits. 75%-100% is the target value, the lesser it is the worse.
Code affected by developer
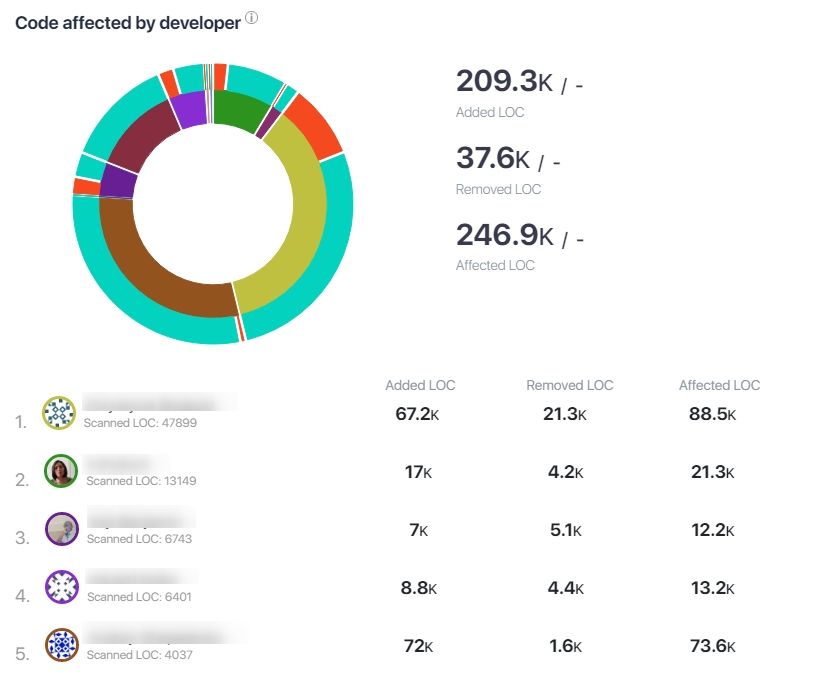
Amount of code added, deleted and affected (touched) by each developer. It's an important chart to identify developers with high influence on the codebase. Developers with a high amount of affected lines of code (LOC) are ones who know the codebase better and are first to contact if something goes wrong.
Developers
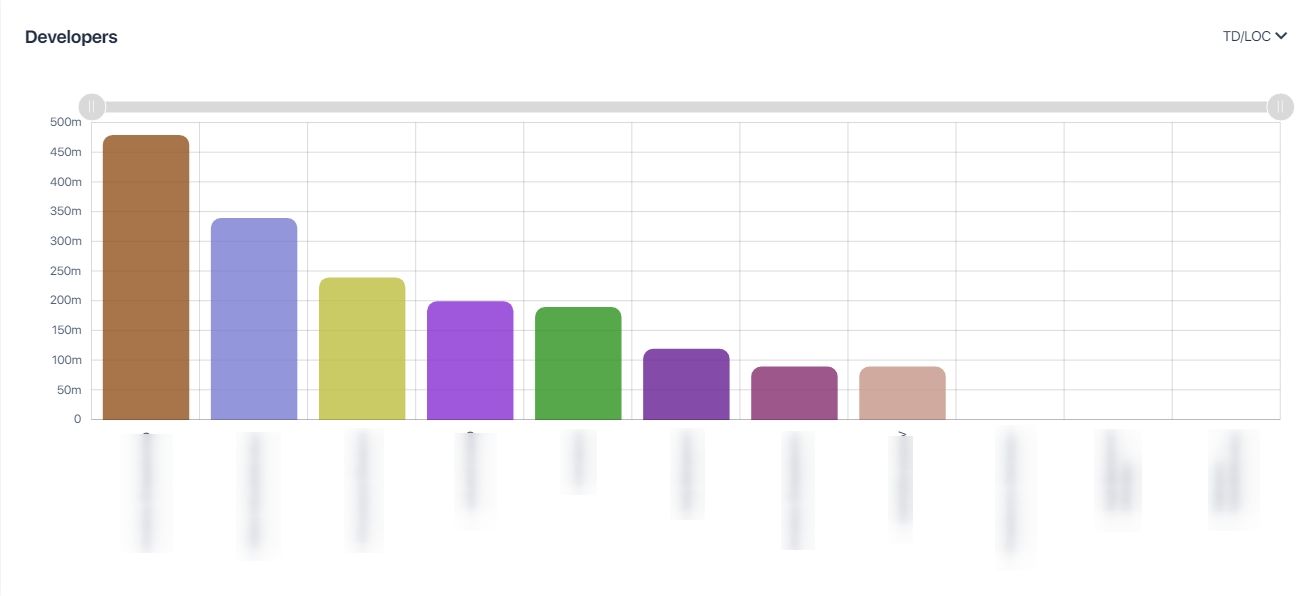
Shows all active committers and their metrics related to repository/project for chosen period. Contains graphs per developer for chosen ratio or metric. Total graph shows overall developer progress and per day graph shows data by commit days only. Expanded developer details show all developer values per commit day.
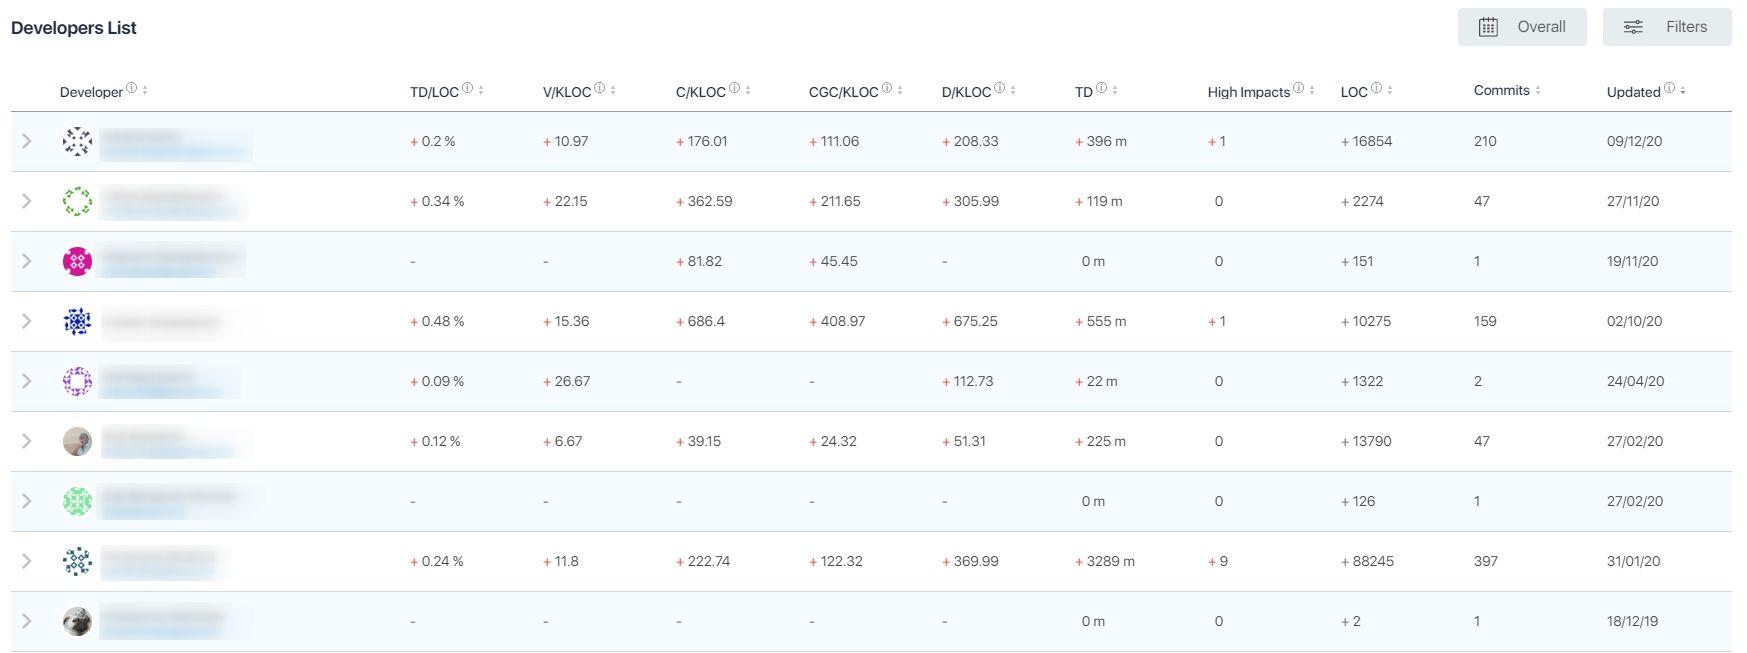
Commits
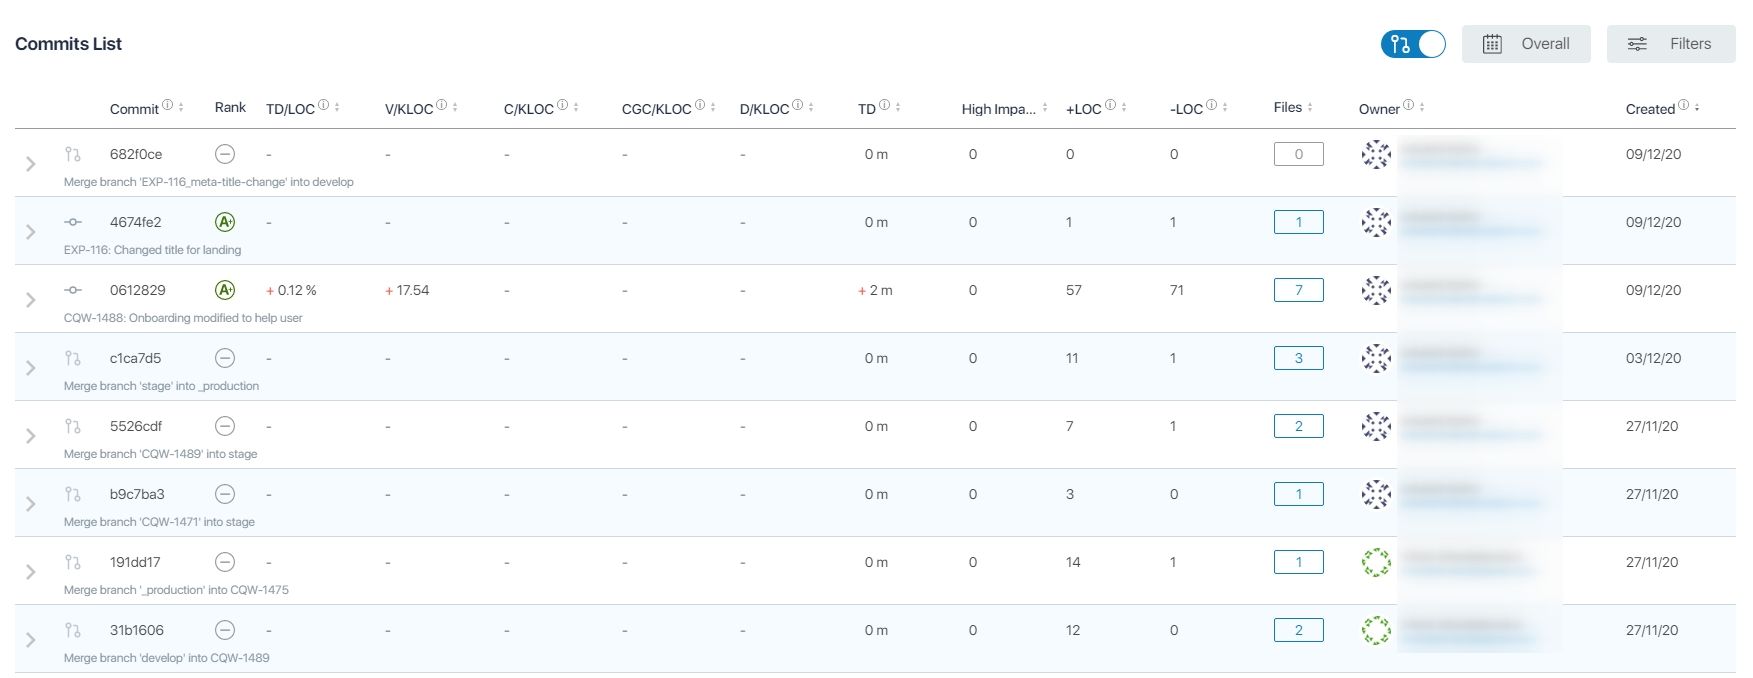
Contains list of scanned commits and merges with metrics related to repository/project for chosen period. If a commit is linked to the Jira issue then it is possible to proceed to this issue in Jira via a link in the "Issue" column. Commits with only supported languages are scanned in a repository.
Supported languages: Python, Java, Java Script, C#, C++, Erlang, PHP, Puppet, Flex, PL/SQL, VB (.Net).
Violations
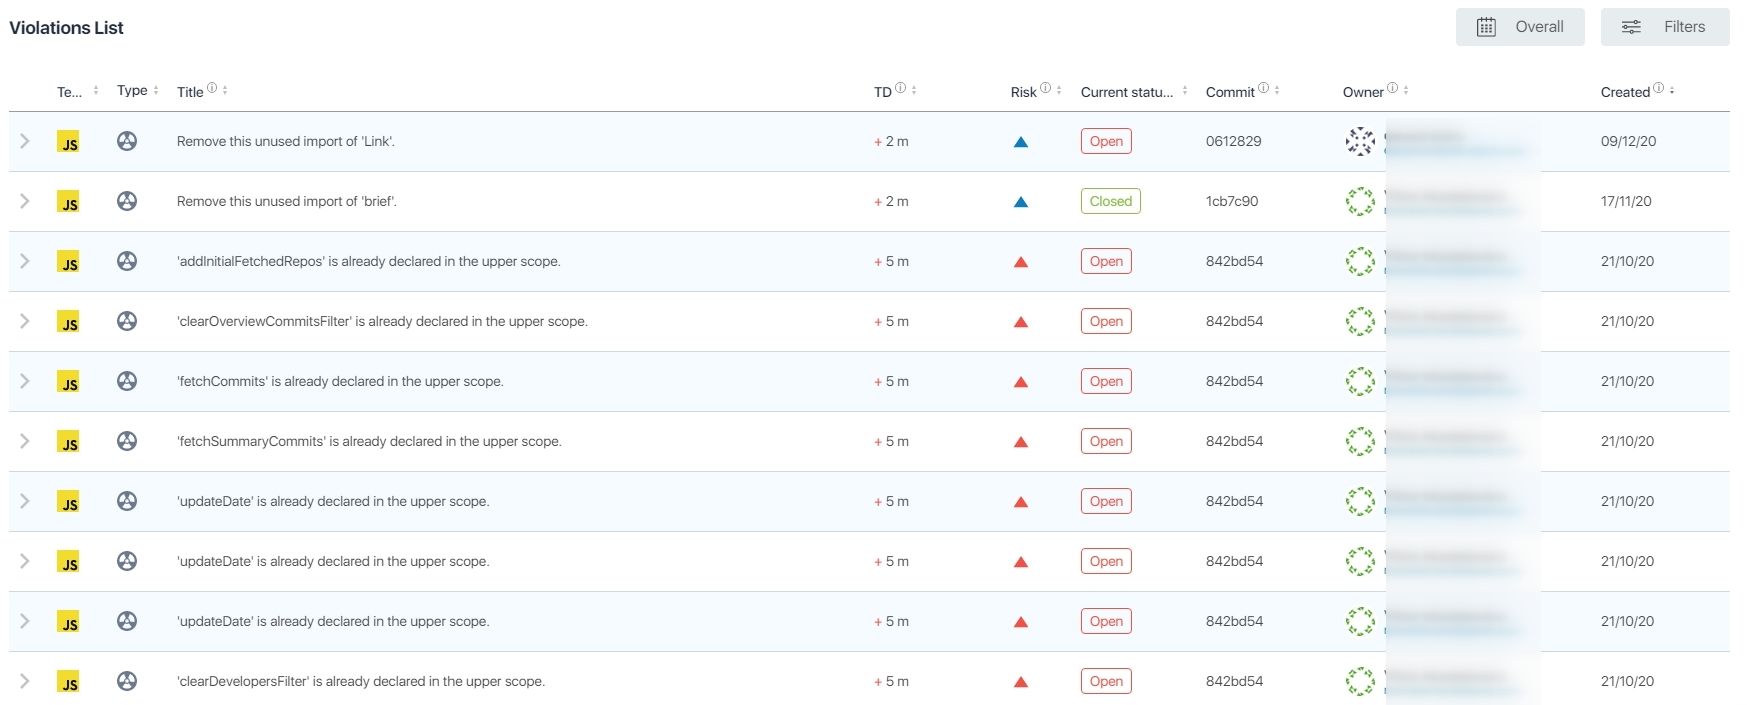
Contains a list of all violations related to repository/project for the “Overall” period. Allows to see a snippet of the code that contains violation, fixing recommendations and related standards. Possible to create a Jira issue for any violation.
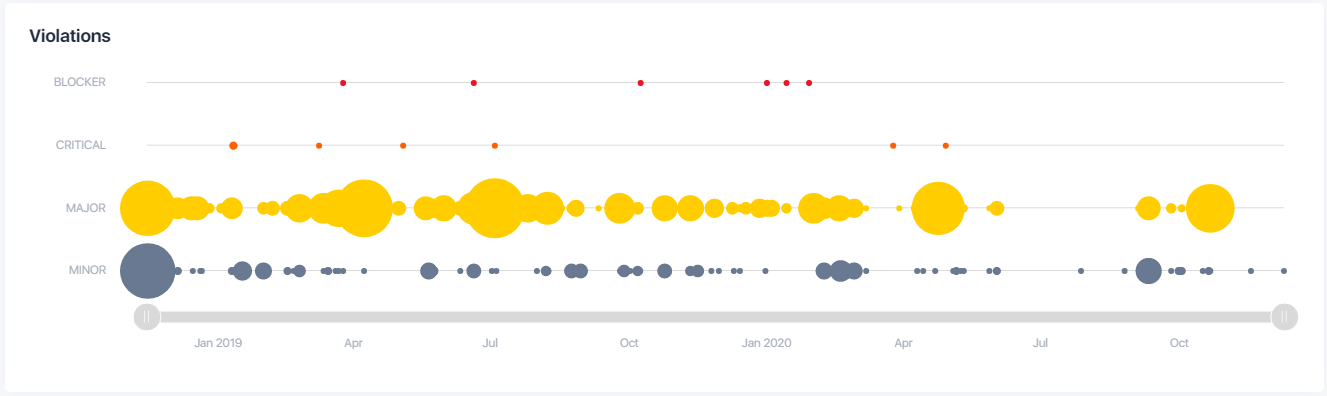
Overview
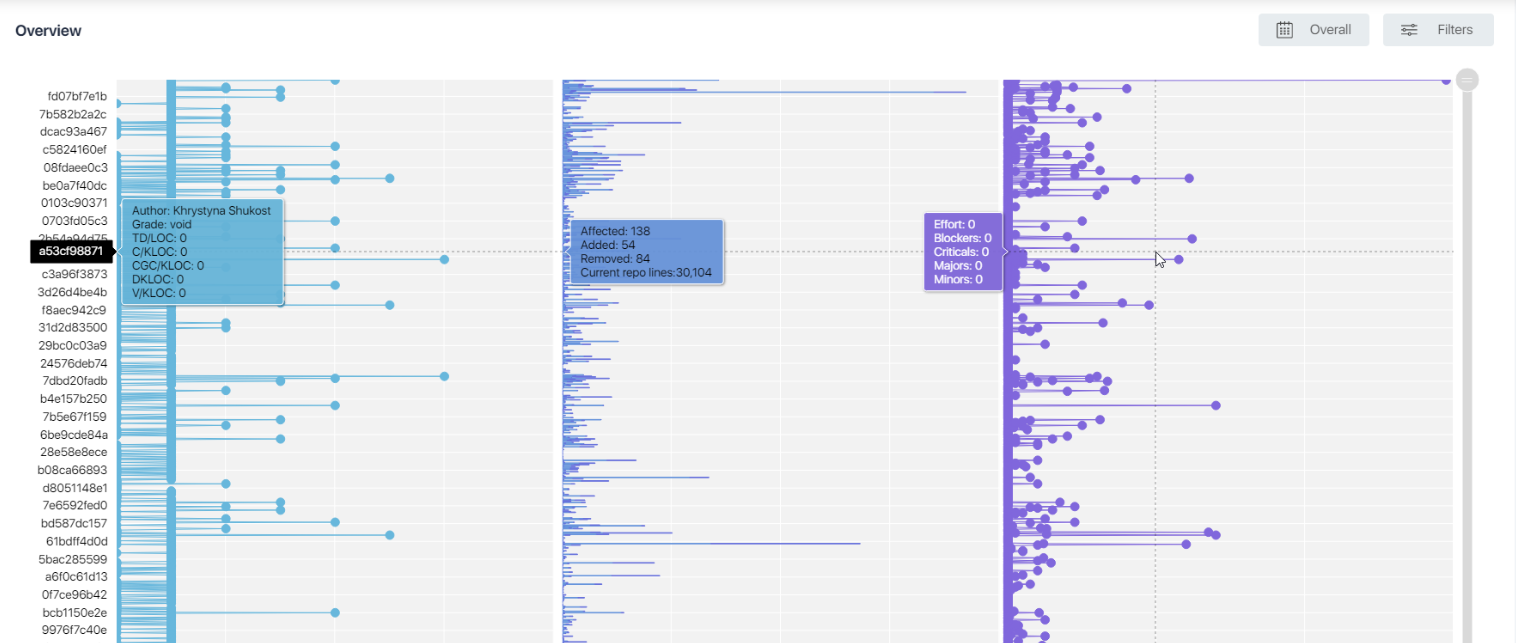
The chart provides a bird-eye-view of your project
Conclusion
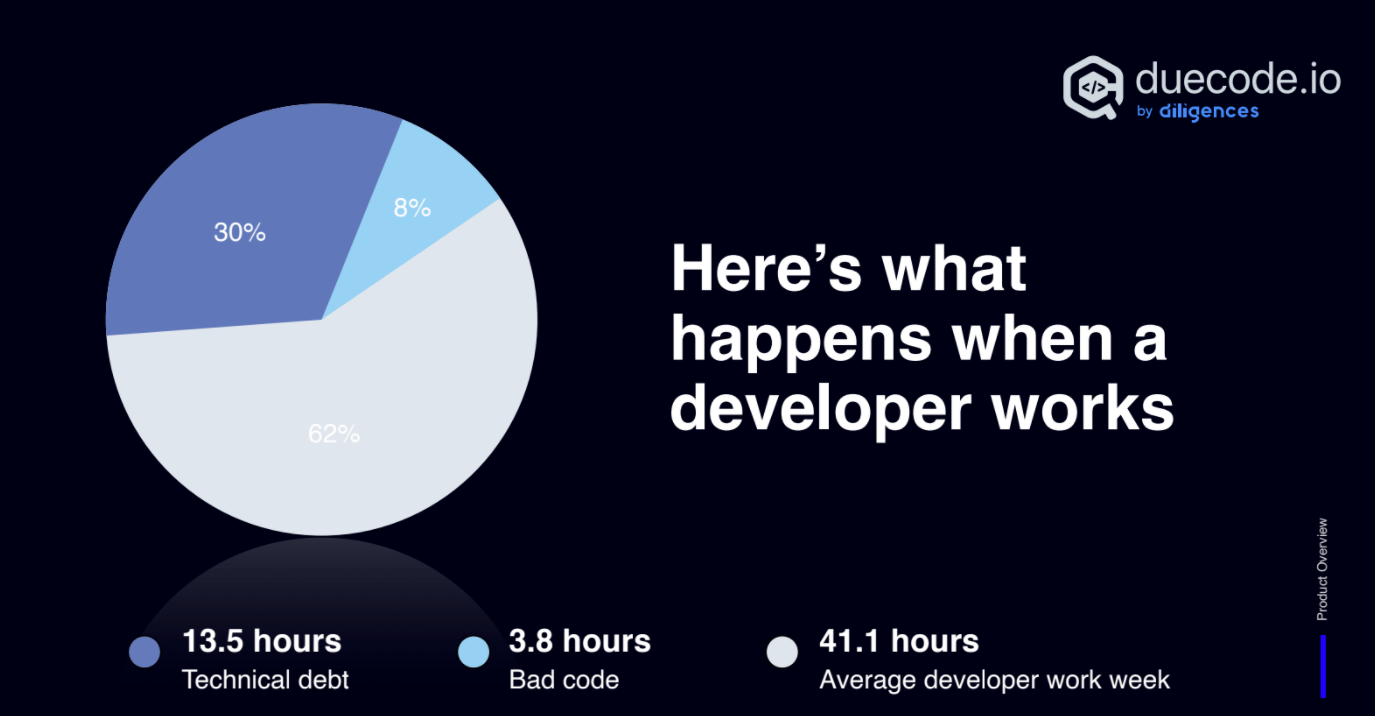
Code quality analysis and audits have become an essential process for every development project today. While it’s a priority for senior executives to increase the productivity of their developers, the average developer spends more than 17 hours a week dealing with maintenance issues, such as debugging and refactoring.
In addition, they spend approximately four hours a week on “bad code”. That is why it is important to use a code quality dashboard in full compliance with requirements of the manager and the project. Thus, Duecode Code quality Dashboards will surely come to your rescue when it comes to delivering quality software.
FURTHER READING
- Complete Code Quality Guide
- Code Quality Tools
- Code Quality Metrics
- Code Quality Standards
- How to measure, check and improve code quality:
-- How To Check Code Quality?
-- How To Measure Code Quality
-- How Can I Improve My Code Quality
-- How To Build A Website With Good Quality Code?
Updated on the 1st of November, 2021